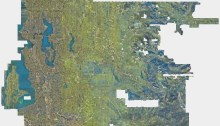
2019 Aerial Imagery: from camera to map

As King County was taking delivery of the 2019 digital imagery data from its vendor, EagleView Technologies, GIS analysts, cartographers, and software engineers across King County government, plus users of our GIS products throughout the area, anxiously awaited the creation, from the delivered data, of a variety of secondary imagery products for use in their analyses, maps, and applications.

Dee Molenaar, renowned Pacific Northwest mountaineer, author, artist, and Cartographer

Whether familiar with the history and personalities of mountaineering or not, cartography students of a certain age who studied mapmaking at the University of Washington would frequently hear the name of an earlier UW grad, Dee Molenaar. Any who aspired to turn their hand to depicting terrain on maps would learn from their professor of the exemplary landform maps created by Molenaar.

GIS and all of us

Today I find myself in a field, GIS, that was practically in its infancy when I started to learn how to make maps, but which has engulfed cartography in what has become a vastly broader spatial-knowledge and spatial-communication industry. There is no better evidence of that than the annual Esri User Conference which I and many of my King County colleagues are attending this week.

Turning Adobe Illustrator map art into web-map data

Some modern mapmaking tools don’t have direct antecedents. Yes, maps have long been composed of many layers of separate artwork just as we have digital map feature layers now, but in the during the time of Mylar overlays, pin registration, and photomechanical reproduction that resulted in static paper maps, there was nothing like the dynamic and highly interactive web maps that are second nature to us today.

A just-in-case map gets the call

King County Metro Transit, in coordination with area jurisdictions, including the City of Seattle, has long designated a network of high-ridership bus routes that can use typically plowed streets and which avoid steep hills to provide a reduced but core level of service during major snow events.

It is fortunate that weather conditions over the last six years had not necessitated the activation of Metro’s Emergency Snow Network and the publication of their Emergency Snow Network map. That is until two days ago.

When is a location not a location?

Cartographers and GIS analysts often have to make choices about where, within a given map space, to position points that represent real-world features. Shouldn’t be a big deal though, should it? A place is a place, a location a location. It’s just there. You know, where the house or building or parking lot, or whatever, sits on the ground! Well, it isn’t that simple.

Map literacy and the 2016 presidential election

Among the fundamental skills required to be map literate, that is, to be able to read and comprehend maps, are an understanding of scale, the recognition of spatial orientation, and an appreciation of map projections. A higher-level, overarching principle of map literacy is that a single map can seldom tell a whole story, which is a point well made by Dr. Kenneth Field, Esri senior cartographic product engineer, in a recent article in Wired.

Cold-War Soviet cartography in our own backyard

The Seattle Times on Saturday, June 2, published an article by staff reporter Erik Lacitis about a “secret, massive program that produced a million maps of cities and places around the world.” The mapping program is fascinating both from a cartographic perspective and a local perspective since Seattle and its environs are among the parts of the United States that were mapped.