
Ruling pen and T-square
My forty-plus years in cartography have seen a vast transformation in the tools that we use to construct maps, and in the options we have for publishing finished maps. Many of the digital tools that I use today, such as the graphic line drawing and text manipulation tools in software like Adobe Illustrator, replace the manual tools that I learned how to use as a cartography student.
I can wax nostalgic about ruling pens and phototypesetting at the drop of a hat (as this post attests), but I sure don’t miss having to rely on them when I can now draw lines of exact length and width, precise angle, and minutely specified color (all with no ink bleed!), and set intricately formatted text in a matter of seconds as opposed to the days that it used to take to spec a type order, send it off to a typesetting shop for the professional typesetters to perform their magic, convert the result to some form of paste-up medium, and then go to work with knives, rulers, and line-up grids to position it all.
Some modern map-making tools don’t have direct antecedents. Yes, maps have long been composed of many layers of separate artwork just as we have digital map feature layers now, but during the time of Mylar overlays, pin registration, and the photomechanical reproduction processes that resulted in static paper maps, there was nothing like the dynamic and highly interactive web maps that are second nature to us today.
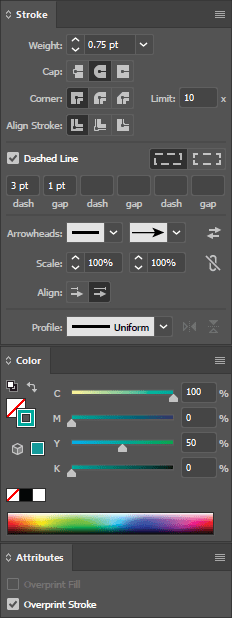
Precise settings for drawing lines digitally
Overall, much of my work making maps has stayed the same in principle, but migrated to vastly better tools. Yet much is new and unprecedented, offering formerly unavailable opportunities for both mapmakers and map readers.
One of the things that I enjoy most about the evolution of the tools and resources that I have at my disposal is the ability to bridge different map-making and map-publishing media. I frequently use both graphic arts software, in particular Adobe Illustrator, and GIS software, mostly Esri’s ArcGIS products. I rely on Illustrator to be able to produce the full range of graphic styles and effects that I want to achieve in my maps. And I rely on GIS software to create maps that harness powerful capabilities of data management, spatial analysis, and dynamic display.
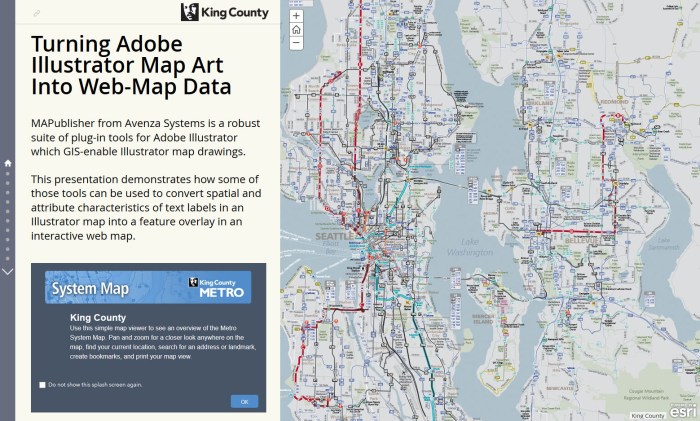
Of the many projects here in the King County GIS Center that represent this blend of GIS and graphic science and art, perhaps the most representative is the Metro Transit System map viewer. I’ve written about the master Metro system map before in these pages. But recently I gave a short presentation to the King County GIS User Group that honed in on one of the key production methods that helps turn the project into a two-way street from GIS to Illustrator and back to GIS.
For the presentation I prepared a story map which demonstrates the process by which artwork in an Illustrator map drawing, which was made using GIS data, is ultimately exported after all map production is complete as new spatial data layers for use in the interactive system map.
Such hybrid GIS/graphic-arts methods represent the best of both worlds for mapmakers and I am delighted to have seen them come to fruition during my career. Many of the map-making tools and technologies that were standard to the profession forty years ago were highly ingenious. Thankfully, technological ingenuity doesn’t rest on its laurels which has kept the profession of cartography ever fascinating and always rewarding.
Patrick Jankanish is Senior Cartographer in the King County GIS Center.


