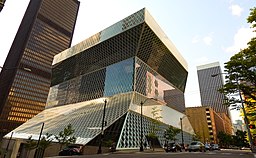
Seattle Central Library
Andrew Smith, Seattle, WA
CC BY-SA 2.0, via Wikimedia Commons
Seattle, the county seat for King County and the largest city in the state of Washington, has seen great growth in the past 15 years in the construction of new buildings and infrastructure, such as the following.
- A new City Hall block.
- The new Central Library designed by the internationally renowned Dutch architect Rem Koolhaas.
- CenturyLink Field, AKA “The Clink,” the home stadium of the Seahawks (NFL) and Sounders (MLS).
- Numerous commercial and residential high-rises.
- A new tunnel under downtown which was dug by “Bertha,” the world’s largest boring machine to date, for a bi-level, subterranean highway which will replace the fragile Alaskan Way Viaduct.
- New, larger container cranes replacing older, smaller cranes along the working southern waterfront.
- And just to the north of downtown, a transformed South Lake Union neighborhood whose building boom includes Amazon’s headquarters campus with its trio of distinctive biospheres.
A striking indicator of this growth is that entering 2017, Seattle had the most construction cranes of any city in the United States at 62! (Seattle Times)

A common feature of the downtown Seattle landscape, construction cranes, as “illuminated” and captured by lidar with the resulting “point cloud” of recorded laser pulses viewed from the side.
During this same 15-year span, here in the King County GIS Center we have added two sets of vintage “lidar” data for the county to our GIS data library. Lidar is an aerial-borne remote sensing technology that uses laser light pulses, much like radar uses radio waves, to detect and collect information about objects and surfaces via reflected signals. Lidar data is typically used to produce digital 3D elevation models of both the bare ground surface (as if there were no structures or vegetation) and a surface that includes above-ground features.
In 2002 the entire county was scanned by lidar and the resulting raw data was processed to produce a raster data grid that has a horizontal ground resolution of six feet per pixel. (Imagine a net of six-by-six-foot squares draped over the whole county, with an elevation value recorded for each square, or pixel). In 2016 most of the western part of the county was scanned at a resolution of three feet per pixel. With two sets of vintage lidar elevation data it is possible to detect and represent the changes that have occurred between the two years by subtracting, pixel by pixel, the elevation values in one surface model from the other.
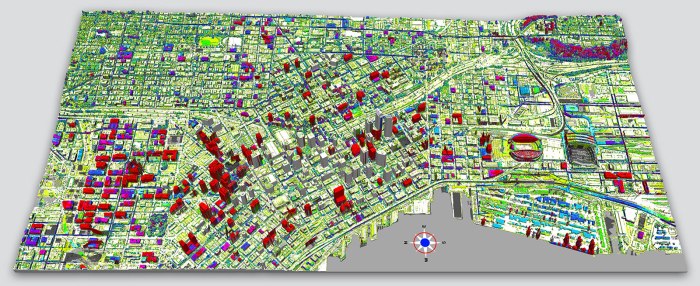
Changes in the downtown Seattle landscape between 2002 and 2016 as revealed by comparing lidar-derived digital elevation models from those years.

Change in height, in feet.
Using “highest hit” lidar surface models, that is, modeled surfaces which include the tops of above-ground features, we subtracted the 2002 lidar elevation values from the 2016 elevation values. Positive-value results represent new buildings or other new above-ground features, while negative-value results represent features that have been removed, such as demolished buildings. In the 3D illustration above of the downtown Seattle area, positive values are symbolized in the yellow-to-green-to-blue-to-red color range, and negative values are symbolized in the gray-to-black range. No change in elevation between the two years is represented as white. (These colors have been applied to the tops of features, the gray shading on the sides of buildings is for the 3D effect only.)
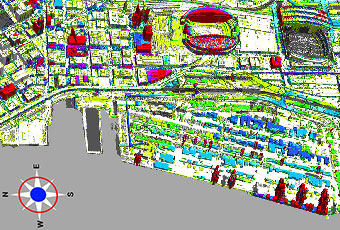
CenturyLink Field (top, right of center), Safeco Field (top, far right), Pier 48 (middle, left of center), and container cranes (lower right).
You can see in an enlarged portion of the illustration some of most curious and striking differences between the 2002 and 2016 lidar data.
- The CenturyLink Field stadium was under construction during 2002, including the west roof, but the east roof had not yet been built.
- Safeco Field next door (to the south) had its roof closed during the 2002 lidar scan and open during the 2016 scan, thus the uncovered stadium interior appears as gray.
- Pier 48 (the long pier to the upper right of the compass rose) was topped with a warehouse in 2002, but in 2016 it was gone resulting in gray.
- Some Port of Seattle container cranes along the waterfront west of the stadiums that were present in 2002 are gone (gray), but now there are many new and taller cranes (red).
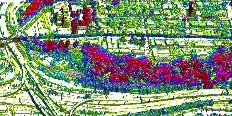
Beacon Hill greenbelt.
There is a major difference between the 2002 and 2016 lidar data sets as a whole, in addition to the difference in resolution, which affects the appearance of growth in the illustration. The 2002 lidar is “leaf-off” data—it was captured during the time of the year when deciduous tree branches were bare which allowed more of the lidar pulses to pass through to the ground than would have occurred if leaves had been on them. By contrast, the 2016 lidar data is leaf-on, which means deciduous tree canopies were more broadly reflective to the lidar signals. As a result, deciduous tree growth is exaggerated in the comparison of the two surface models. See, for example, the sloping sides of Beacon Hill in the upper right of the illustration which is a wooded greenbelt.
Overall, at a glance, it is easy to see the many new “red” buildings (red represents an increase in height of 70 feet or more) that rose during the 14-year span throughout the downtown area. Now in late 2017 the downtown construction boom is continuing, so when we eventually have a chance to compare the 2016 lidar data to a future scan, we can expect to see another set of dramatic changes.
Victor High is a GIS analyst in the KCGIS Center Enterprise Operations group.


