Converting digital terrain data into a 3D printed model of King County
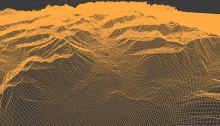
In March of 2019, King County Emergency Management submitted a request to KCGIS Center Spatial Services for a tabletop 3D model of the county to be used for community outreach and education on the variety of physical topography throughout King County and its challenges for emergency management.