COVID-19 and social distancing have made connecting for Equity and Social Justice (ESJ) chats challenging. This interview is one over ‘virtual coffee’ with three King County GIS professionals. Hear them share their technologist’s excitement that GIS for ESJ is feasible and impactful! Meet them below.
Greg: “Mary, Dennis and Fred, as King County IT (KCIT) employees we know that our Equity and Social Justice (ESJ) strategies as One King County are “…to invest upstream and where needs are greatest, in employees and in community partnerships.”
“Grab a coffee and let’s talk briefly about GIS for ESJ.”
Greg – Is GIS a new platform for Pro-equity opportunities by unmasking where the need is greatest in BIPOC, low-income and non-English speaking communities?
Mary: GIS may seem new, but this is a tool that analysts have used for revealing patterns in spatial data for over 40 years.
Fred: It can be. GIS is very dependent on the quality of data and the context in which it’s being used.
Dennis: I would say the use of GIS to further equity work has only just begun and only scratched the surface of what is possible to analyze.
Greg – How has King County used the GIS tool for ESJ and how is it available?
Mary: GIS has been a tool that many departments at King County have used to view and manage assets, identify areas of interest, reveal patterns, and manage workflows. More recently, GIS as an analysis tool, has become more widely available to King County employees through ArcGIS Online.
Greg – How do King County employees access or use GIS tools?
Mary: We have been offering more seminars about GIS. So, more people have been using GIS to answer their spatial questions like: Who, exactly has access to our services? Where do they live? How far do they have to travel to get to that service point? Is there a bus to that point? What language do they most likely speak?
Greg – What specific GIS capability, are you enthusiastic about for its potential to move the needle on equity? Why?
Mary: GIS can reveal the pattern of actions taken to improve equity. Basic maps, dashboards with maps and graphs, and story maps that mix maps, graphs, web pages, videos, and a narrative into an interactive presentation will be able to show the successes of these actions over time.
Dennis: When you are able to show people that government provides less services in large areas of the county where the incomes are lower and there are more people of color, it is impossible for people to ignore or say they weren’t informed about the disparities. Then they must respond.
Fred: Web mapping and free and open source software – both drastically reduce barriers to entry to using GIS. This helps get the tools in the hands of more people, empowering them to ask questions and analyze data from more perspectives, and easily share their findings.
Greg – We’ve seen how GIS makes large datasets visible across our county. Is that significant?
Fred: There are lots of datasets available, but it’s critical to have a good understanding of your data. Factors like how your data were collected, its quality, limitations, and potential biases will have a big effect on what kinds of analyses are possible or appropriate.
Dennis: While GIS is often thought of as mapping software, it requires a skilled GIS staff analyst to implement and make full use. Demographers for example may want to collaborate with a GIS analyst in order to take their studies even further.

Greg – What doesn’t the average King County employee know about GIS that would enable us to take our data and information much further?
Mary: Perhaps the average employee doesn’t know that GIS is available to them either through analysts doing data compilation and interrogation at the GIS Center or using ArcGIS online to create maps and simple analysis for themselves. Also, they may not know that training to use GIS is available through online training websites or that the GIS Center offers in-person training on specific applications.
Greg – How can we partner with the public to use GIS tools for improving equity?
Mary: We offer a publicly available data warehouse that people can explore to find data that may help answer their spatial questions. We also offer an in-person workshop that introduces the idea of using GIS to answer equity questions. We are in the process of creating a data hub that will offer specific equity data sets and applications to the public.
Dennis: Creating interactive GIS mapping experiences and providing them to the public, in libraries and schools, and in the home over the internet, could help interested people to further their Pro-equity work.
Fred: We need to use the appropriate tools and approaches to meet people where they are.
Greg – What do you mean by appropriate tools?
Fred: There’s not going to be a one-size-fits-all solution for the public and we should adapt our ways of soliciting input and sharing information accordingly.
Dennis: I believe GIS will be a great tool for analyzing equity issues. GIS’s spatial analysis capabilities can help expose relationships between place, demographics and outcomes.
Greg – Can GIS amplify the patterns of bias and discrimination creating barriers in delivery of public service to priority populations?
Dennis: It could. GIS is a tool. It is not inherently good or evil. A good example is gerrymandering of political districts. GIS was the tool used to create gerrymandered districts that disadvantage people of color in such places as North Carolina and Wisconsin.
Fred: Yes. Redlining would be another example of spatial discrimination. Currently, we should examine how law enforcement agencies are using GIS. In the day-to-day, negative effects can happen if people aren’t considering potential misinterpretations of their work or applying an equity lens to their projects.
Mary: Maybe.
Greg– What does maybe mean?
Mary: It depends on how the data is compiled, analyzed and displayed. For instance, a map of median household income by census tracts classified so that like incomes are in the same group, tell a different story than a map of per capita income by census block groups classified to highlight the top and bottom 20% of incomes.
Greg: Well, thanks Mary, Fred and Dennis. More to come. Thank you all for joining this GIS for ESJ coffee chat. Questions can be sent to me, Greg Babinski, at greg.babinski@kingcounty.gov .
ABOUT
Greg Babinski, GISP (he/his) is Marketing and Business Development Manager for the King County GIS Center in Seattle. He holds an MA in geography from Wayne State University. Babinski is Past-President of URISA and Founder/Past-Chair of URISA’s GIS Management Institute. Most recently Greg has focused on the application of GIS for issues related to equity and social justice. He is co-author of the URISA-Certified Introduction to GIS for Equity and Social Justice Workshop. He is an American Geographical Society 2019-2020 Ethical GEO Fellow.
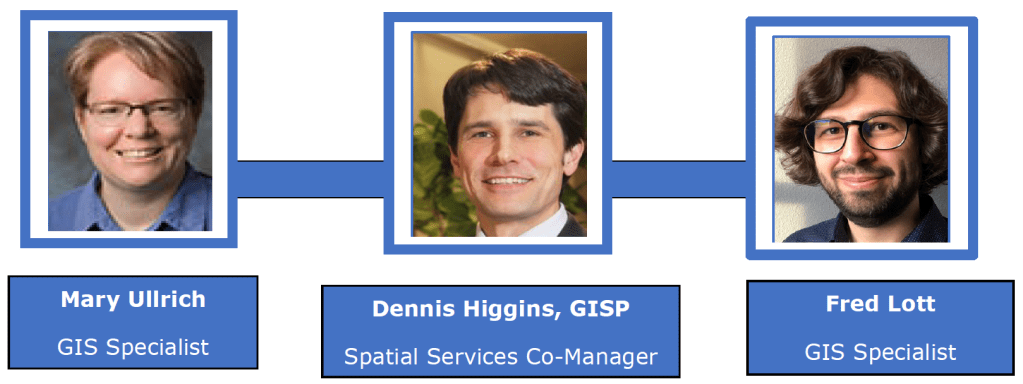
Dennis Higgins, GISP (he/his) is the Spatial Services Co-Manager with the King County GIS Center in Seattle, Washington. He is a Geography graduate of the University of Washington.
Mary Ullrich, (she/her) is a GIS Specialist with King County GIS Center in Seattle, Washington. She has a BA Geography and minor in Environmental Studies from Central Washington University.
Fred Lott, (he/his) is a Senior GIS Specialist with the King County GIS Center in Seattle, Washington. He has a BS and MS in Civil & Environmental Engineering from Lafayette College and the University of Washington.


Pingback: GIS Day 2020 – King County GIS looks back and looks to the future | GIS & You