To my lasting good fortune, my first exposure to cartography as a student was in the classroom of the great John Sherman at the University of Washington. “Great,” however, is too facile an adjective to use for Dr. Sherman. My memory of him is more nuanced. I saw him as an unassuming but completely self-assured and assuring teacher who epitomized the best principles of the craft and discipline of mapmaking. He communicated with care and effectiveness as an instructor. For example, I clearly recall suddenly being able to see landforms emerge from abstract elevation contour and stream lines when, after struggling with my attempts to even begin a color-pencil-on-Mylar hillshading exercise, Dr. Sherman deftly demonstrated the technique at my drafting table on a small portion of my project.
Dr. Sherman also grounded his students in the core tenets of communicating information via maps. One can read his and Waldo Tobler’s exposition of one of those tenets in the 1957 paper “Multiple Use Concept in Cartography” published in The Professional Geographer (Sherman and Tobler 1957). I was unaware of the paper two decades later as I was studying cartography, but I didn’t need it, I was learning about multiple use firsthand in the classroom—and in the darkroom in those pre-digital days—from one of its authors.
The re-use and re-purposing of map elements, especially digital map data, may seem simple and obvious since we are far past the time when the availability and use of digital data and production practices became the norm in cartography. But it hasn’t been all that long—well within the span of my career—since the time when mapmakers were beholden to the technical strictures imposed by mechanical map construction methods, such as fixed inked or scribed line weights, immutable photo-set sheets of type, and the inalterable scale-specific generalization of map features. When one was so locked in to map design choices by the physical nature of the production materials, careful planning was required not only for creating the map at hand, but for enabling those same production materials to be re-used to make different maps, which is at the core of the multiple-use concept.
Whether the methods are mechanical or digital, many mapmaking projects require an investment in what Sherman and Tobler referred to as “the aggregation of smaller cartographic labors.” Planning for the re-use of the products of those “considerable” labors can greatly increase the value of the investment required to build a map.
I don’t intend to go into the variety of ways that we as map designers can plan and implement methods for the multiple use of cartographic resources, at least not now. And if you’re interested in the historical perspective, I’ll direct you to an evaluation of the Sherman and Tobler multiple-use concept that Nicholas Chrisman included in an article that he wrote on the role that John Sherman played in the origins of GIS (Chrisman 1997). Rather my goal here is to illustrate by example through one particular map project.
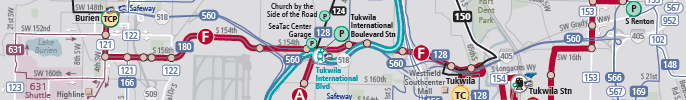
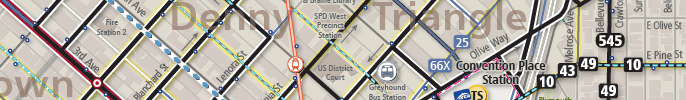
In 2012, King County Metro Transit asked the Client Services group in the King County GIS Center to create a new comprehensive map of its system. Although Metro was no longer offset printing a system map for mass distribution, they still needed to produce up-to-date maps to serve their customers by posting them in key locations such as transit centers throughout their service area, and in digital form online.
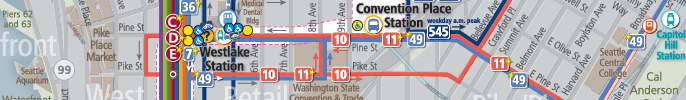
The development process for the new map indeed involved considerable design and production effort, including the typical aggregation of “smaller cartographic labors” into a final product that represented a substantial investment. In anticipation of the investment, a master map file was constructed in such a way that not only could it be revised easily on a regular schedule, which is a must when the core information contained in the map—the system of bus routes—is itself revised two to three times each year, but also could be adapted to create other maps.

Recently I did a quick survey of our project files and made a discovery that prompted me to write this post. In the five years since Metro first invested in the new master system map, I am happy to say that in addition to the regularly scheduled updates to the map features, that same master map has spawned more than two dozen distinct derivative maps. The spinoffs range from the originally planned sub-area excerpts of the master map, to similar system-oriented maps of greater and lesser detail over a wide range of scales, to maps that are completely new but which nevertheless incorporate symbols and styles developed for, or extrapolated from, the master system map.
By taking advantage of the planning that went into the development of the master system map, each of the spinoff maps was produced at a lower cost than would have been entailed if they had been developed from scratch. Future blog posts may detail some of the planning steps and the resulting map production resources that can be re-used. But for now, suffice to say that the example of the master King County Metro Transit system map illustrates that the concept of multiple use in cartography is as relevant now as it was when Sherman and Tobler wrote about it in 1957 and when Dr. Sherman was teaching it to me and my fellow cartography students in 1977.
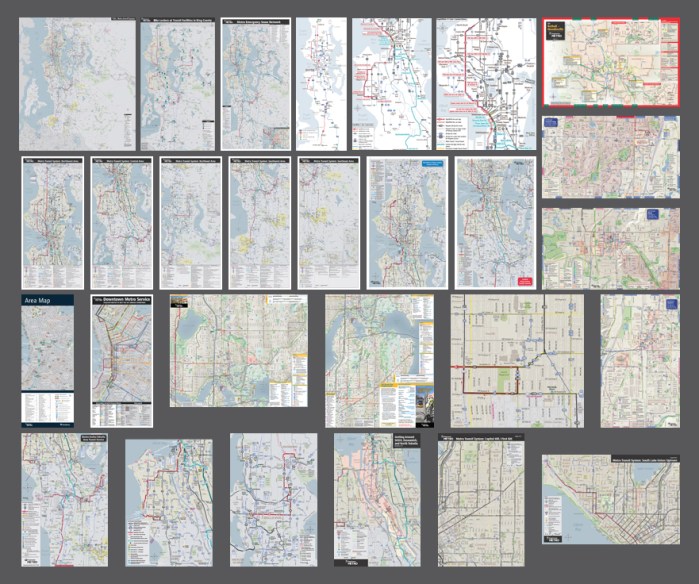
An array of maps derived from the master Metro Transit system map which is in the upper left.
Patrick Jankanish is Senior Cartographer in the King County GIS Center and is a member of its Client Services group.
Sherman, J. C. and Tobler, W. R. (1957), Multiple Use Concept In Cartography. The Professional Geographer, 9: 5–7. doi:10.1111/j.0033-0124.1957.095_5.x


Pingback: The marks we leave: John Spellman, 1926-2018 | GIS & You
Pingback: A just-in-case map gets the call | GIS & You
Pingback: Turning Adobe Illustrator map art into web-map data | GIS & You
Pingback: Turning Adobe Illustrator map art into web-map data | GIS & You - GeoJoint