There is a wide array of powerful free open-source tools for doing data analysis, and many of them can now handle spatial data. This post will focus on using R, specifically the tidyverse packages, as a data exploration tool for analyses that would otherwise be cumbersome in a traditional desktop GIS program.
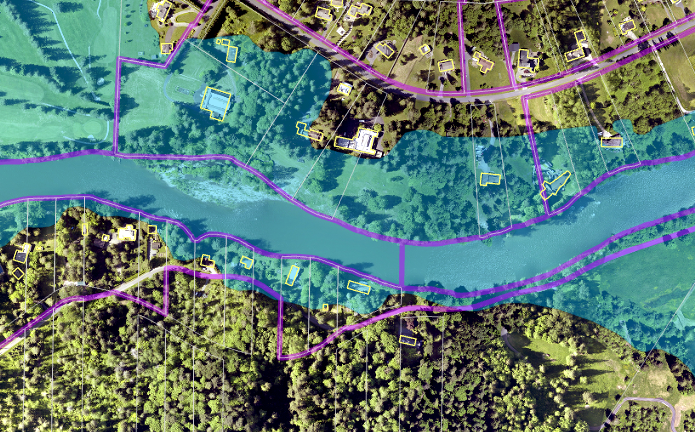
I am currently working on a project to improve counts of residents in hazard areas and to estimate their demographics from census data. A simple version of this analysis would be to overlay the hazard area with something like census blocks or parcels. However, for this project we are interested in hazard areas that directly affect buildings on a parcel. Moreover, the sequence of analyses needs to be flexible enough to easily drop in new or updated hazard layers and census information.
The project started off with data for the entire county: over 600,000 parcels, 35,000 census blocks, about 1 million building footprints, and various other spatial and tabular datasets. After trying out a few different tools for my analysis, I decided to go with R.
About R
R’s website describes the project as follows: “R is ‘GNU S’, a freely available language and environment for statistical computing and graphics which provides a wide variety of statistical and graphical techniques: linear and nonlinear modelling, statistical tests, time series analysis, classification, clustering, etc.” One of R’s biggest strengths is its huge repository of about 14,000 community-created extension packages, including several that focus on geospatial data (such as sf or arcgisbinding). In addition to this, the RStudio project has created a user-friendly front-end for R that includes a code editor, console, file browser, object browser, documentation viewer, and more.
There is a collection of R packages known as the tidyverse that makes it easier to do data science work in R. An important aspect of this collection, as listed on its site, is that “[all] packages share an underlying design philosophy, grammar, and data structures.” This is very helpful, as it makes it easy to work with lots of different packages without having to focus on syntax details or converting formats. The book R for Data Science is a good resource for learning more about using these packages. It is available via creative commons license online.
While there are lots of other good choices for doing data analysis work, I want to go over why I felt that, for me, R was the best tool for the job in this particular scenario.
- Why not ArcGIS? A majority of my data were tabular, not spatial. I wanted to do exploratory data analysis with lots of intermediate results, and string together multiple queries that would take too many steps within the ArcGIS software. Also, I wanted a set of scripts to help automate analyses.
- Why not Python? I’m more familiar with Python and started out with this. However, I ultimately found it easier to use RStudio for the kind of on-the-fly analysis that I was doing, and down the line I’d like to explore the Shiny web app framework for building an interactive visualization dashboard.
- Why not Excel? No matter what I tried, Excel just couldn’t handle the sheer amount of data for this project without crashing.
- Why not PostGIS? This would likely be a great option once I get more familiar with optimizing SQL queries on large datasets where spatial functions are involved. I used PostGIS for some spatial queries at the beginning of the analysis, but not for the main body of tabular data analysis. R does many of the same filtering, grouping, and summary tasks, but with slightly more concise syntax.
Working with R
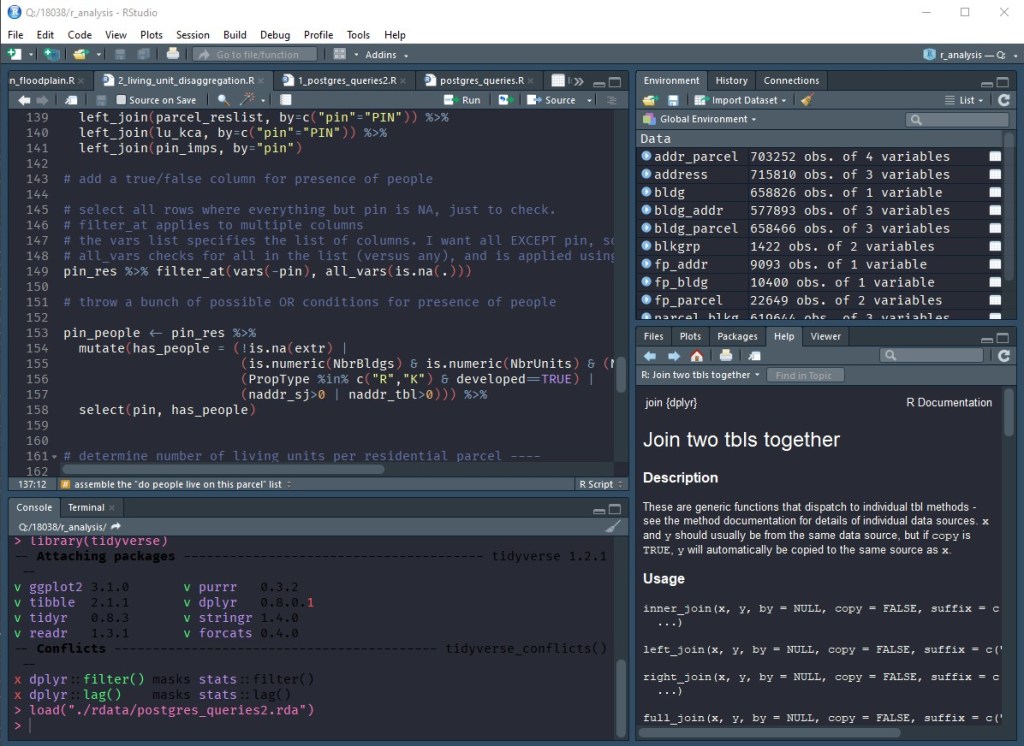
R is great at reading in data from lots of different sources. The tidyverse adds convenient functions for reading text files, Excel files, web data, and binary formats. You can also connect to databases using DBI. DBI is used in conjunction with DMBS drivers to connect and send queries to Microsoft SQL Server, PostgreSQL, SQLite, and other databases. This allows the user to send a SQL query directly to the database from with R and get the results back as a table that can be used for continued analysis. Also, if you don’t want to write SQL, it can read a table reference directly into R, write grouping/summary code, and have it generate the SQL query for you.
Half the battle is getting your data in a usable format, and that’s where packages like readr, tidyr, and stringr are helpful in cleaning up, reshaping, and reformatting data. The theory behind “tidy data” is that “each variable is in its own column, and each observation is in its own row.” Once you have tidy data, dplyr gives you the ability to filter, group, combine, and summarize your data any way you want. You can use ggplot2 to visualize your data as well. The real power in these tools (and similar tools like pandas for Python) is shortening the time and effort between posing a question and getting an answer. Even if a line of inquiry is a dead end, you haven’t lost much time to get there. Then, when you settle on an analysis methodology, your step-by-step process is already there in the code to reuse in the future. I’ve been able to answer complex questions during a meeting with just a few lines of code and get an answer in seconds rather than clicking around a GUI and waiting for a chain of tools to run. The learning curve for these tools pays off surprisingly quickly.


Pingback: Using R and RStudio as a Fast and Flexible Data Exploration Tool |
Dear Sir,
I am currently working on a large area in Tamil Nadu, India, for multi-hazard zonation and vulnerability mapping.
Sir, I am new to R and unknown to the newest versions of ArcGIS / pro.
I am willing to learn R and R Studio; and I am really good at quick grasping. Could you kindly suggest and guide me in using the same software for analysing and interpreting multi-hazard zonation and vulnerability for a larger region, or any similar methods. Kindly do the needful
LikeLike