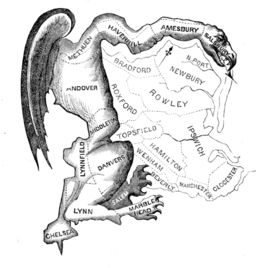
A political cartoon which appeared in the Boston Gazette in 1812 illustrating the salamander-shaped group of districts purportedly drawn to favor the electoral prospects of the party of Governor Elbridge Gerry, hence “Gerry-mander.”
By Elkanah Tisdale (1771-1835) [Public domain], via Wikimedia Commons
How do gerrymandered districts occur? In the United States, the redrawing of federal congressional district boundaries—“redistricting”— is usually done every ten years, shortly after the release of new census data. In principle, the goal of this level of redistricting is to ensure that every person in the United States has equal representation in the U.S. House of Representatives. To achieve this, every congressional district should contain roughly the same number of people.
The U.S. Constitution leaves it up to the states to determine how they conduct redistricting. In many states redistricting of federal and state electoral districts is done by the state legislature. This can result in electoral boundaries that some feel have been drawn unfairly—gerrymandered—by the legislature’s majority party to favor their interests. One way this can occur is through the intentional “packing” of voters of one race, interest group, or political party affiliation into a single district, often one in which their numbers are already strong, thereby diluting their presence and voting influence in other districts. Here is an illustration of how the same number of people can be divided up geographically in different ways to produce vastly different outcomes.
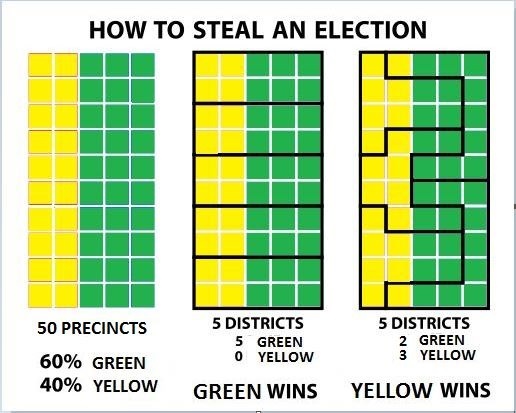
By Steven Nass [CC BY-SA 4.0 (https://creativecommons.org/licenses/by-sa/4.0)%5D, via Wikimedia Commons

Gatehouse Media, via The Fayetteville Observer, August 27, 2017
Here in Washington State we have a bipartisan redistricting commission made up of two appointees each from the two major political parties. These four commissioners select a non-partisan, non-voting fifth appointee to serve as the commission’s chairperson. The intended result is that electoral boundary decisions are made in a cooperative, bipartisan manner, with the fifth appointee guarding against the kind of partisan outcomes represented by gerrymandered districts.
As a GIS professional, I am keenly interested in the role of GIS in redistricting. The spatial-data processing power of GIS technology has completely revolutionized redistricting efforts, making it easier to not just balance the overall numbers of voters into fair distributions across districts, but to unfairly aggregate specific categories of voters into gerrymandered districts. I also know that in the field of elections GIS is used for much more than drawing district boundaries. For example, King County Elections depends on GIS to ensure that every voter receives the correct ballot that includes every race for political office in which they are geographically eligible to cast a vote—from the president of the United States all the way down to the local water commissioner.
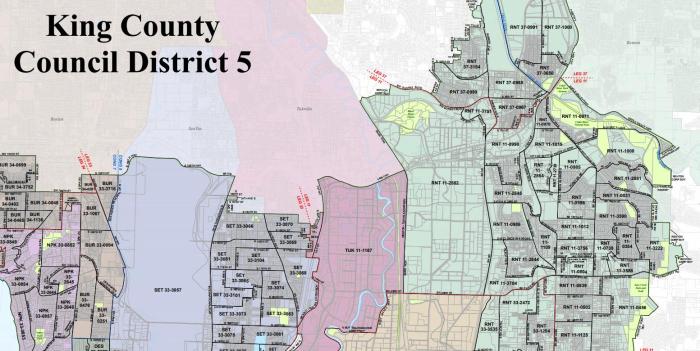
King County Elections also uses GIS to provide information and maps to the public about their voting eligibility and options. Their very informative website contains voter-information look-up and printable maps, like the one illustrated below, that were generated using GIS. The website also provides historical documentation of election turnout, and GIS helps to manage and display that information as well.
These are necessary and benign applications of GIS to the business of elections. But in addition to the North Carolina example cited above, there are many other controversies over electoral boundaries. Wisconsin, for example, is being sued over its most recent redistricting process, with the case scheduled to be heard in the U.S. Supreme Court. A recent New York Times Magazine article explores the issue of partisan gerrymandering in great detail.
In the end, GIS is a tool and like any tool, it can used and abused, depending on the intent of the user. It is up to us as citizens to ensure that we understand this tool and these issues in order to keep democracy healthy at all levels.
Dennis Higgins is the Client Services Manager in the King County GIS Center.


Pingback: Gerrymandering and GIS – problem or solution? | GIS & You
Pingback: NSGIC publishes best practices guidance to improve elections with GIS | GIS & You