The King County GIS Center was recently asked by the Office of Emergency Management to assist with updates to the Hazard Identification and Risk Assessment. This report “…identifies hazards most common to King County with assessment of vulnerability in terms of exposure to impacts, risk in terms of probability of impacts, and consequences in terms of experienced severity of hazard impacts.” The Emergency Management Office uses this document to organize and plan for disaster response. This plan has been approved by FEMA, and is in effect from 10/1/2020 through 9/25/2025.
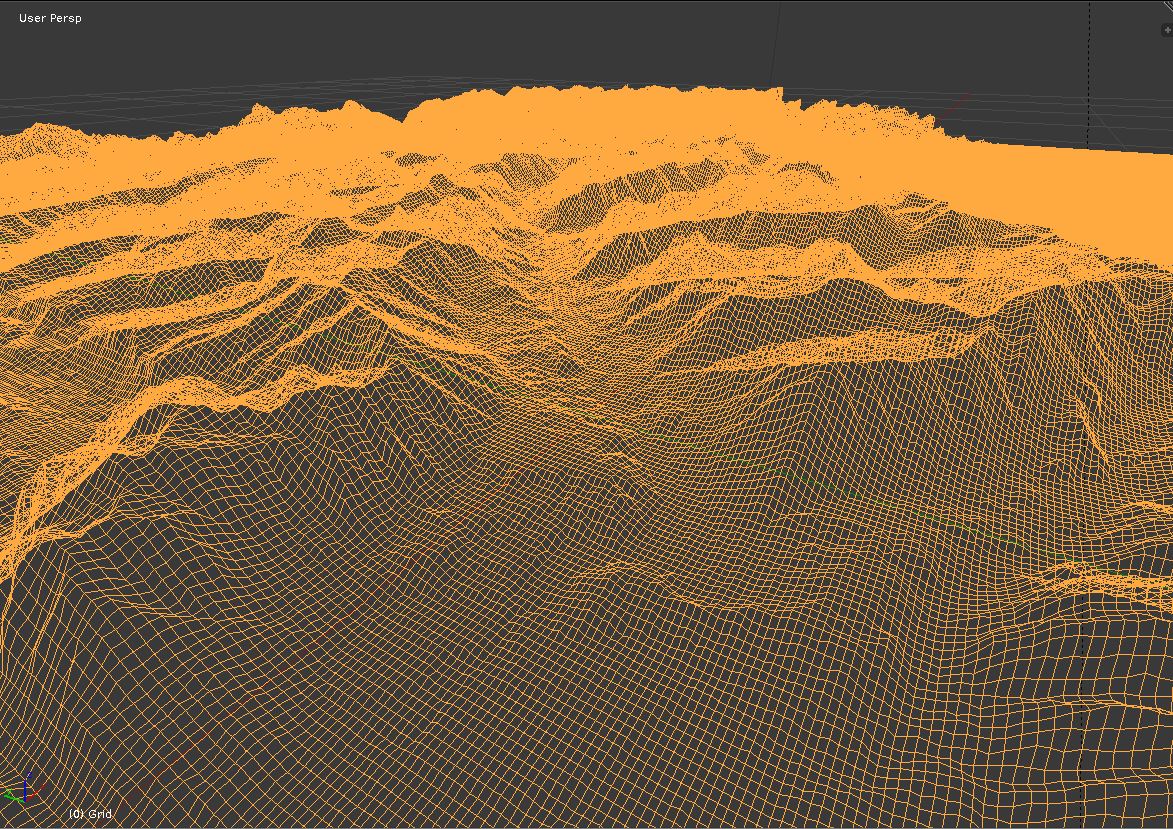
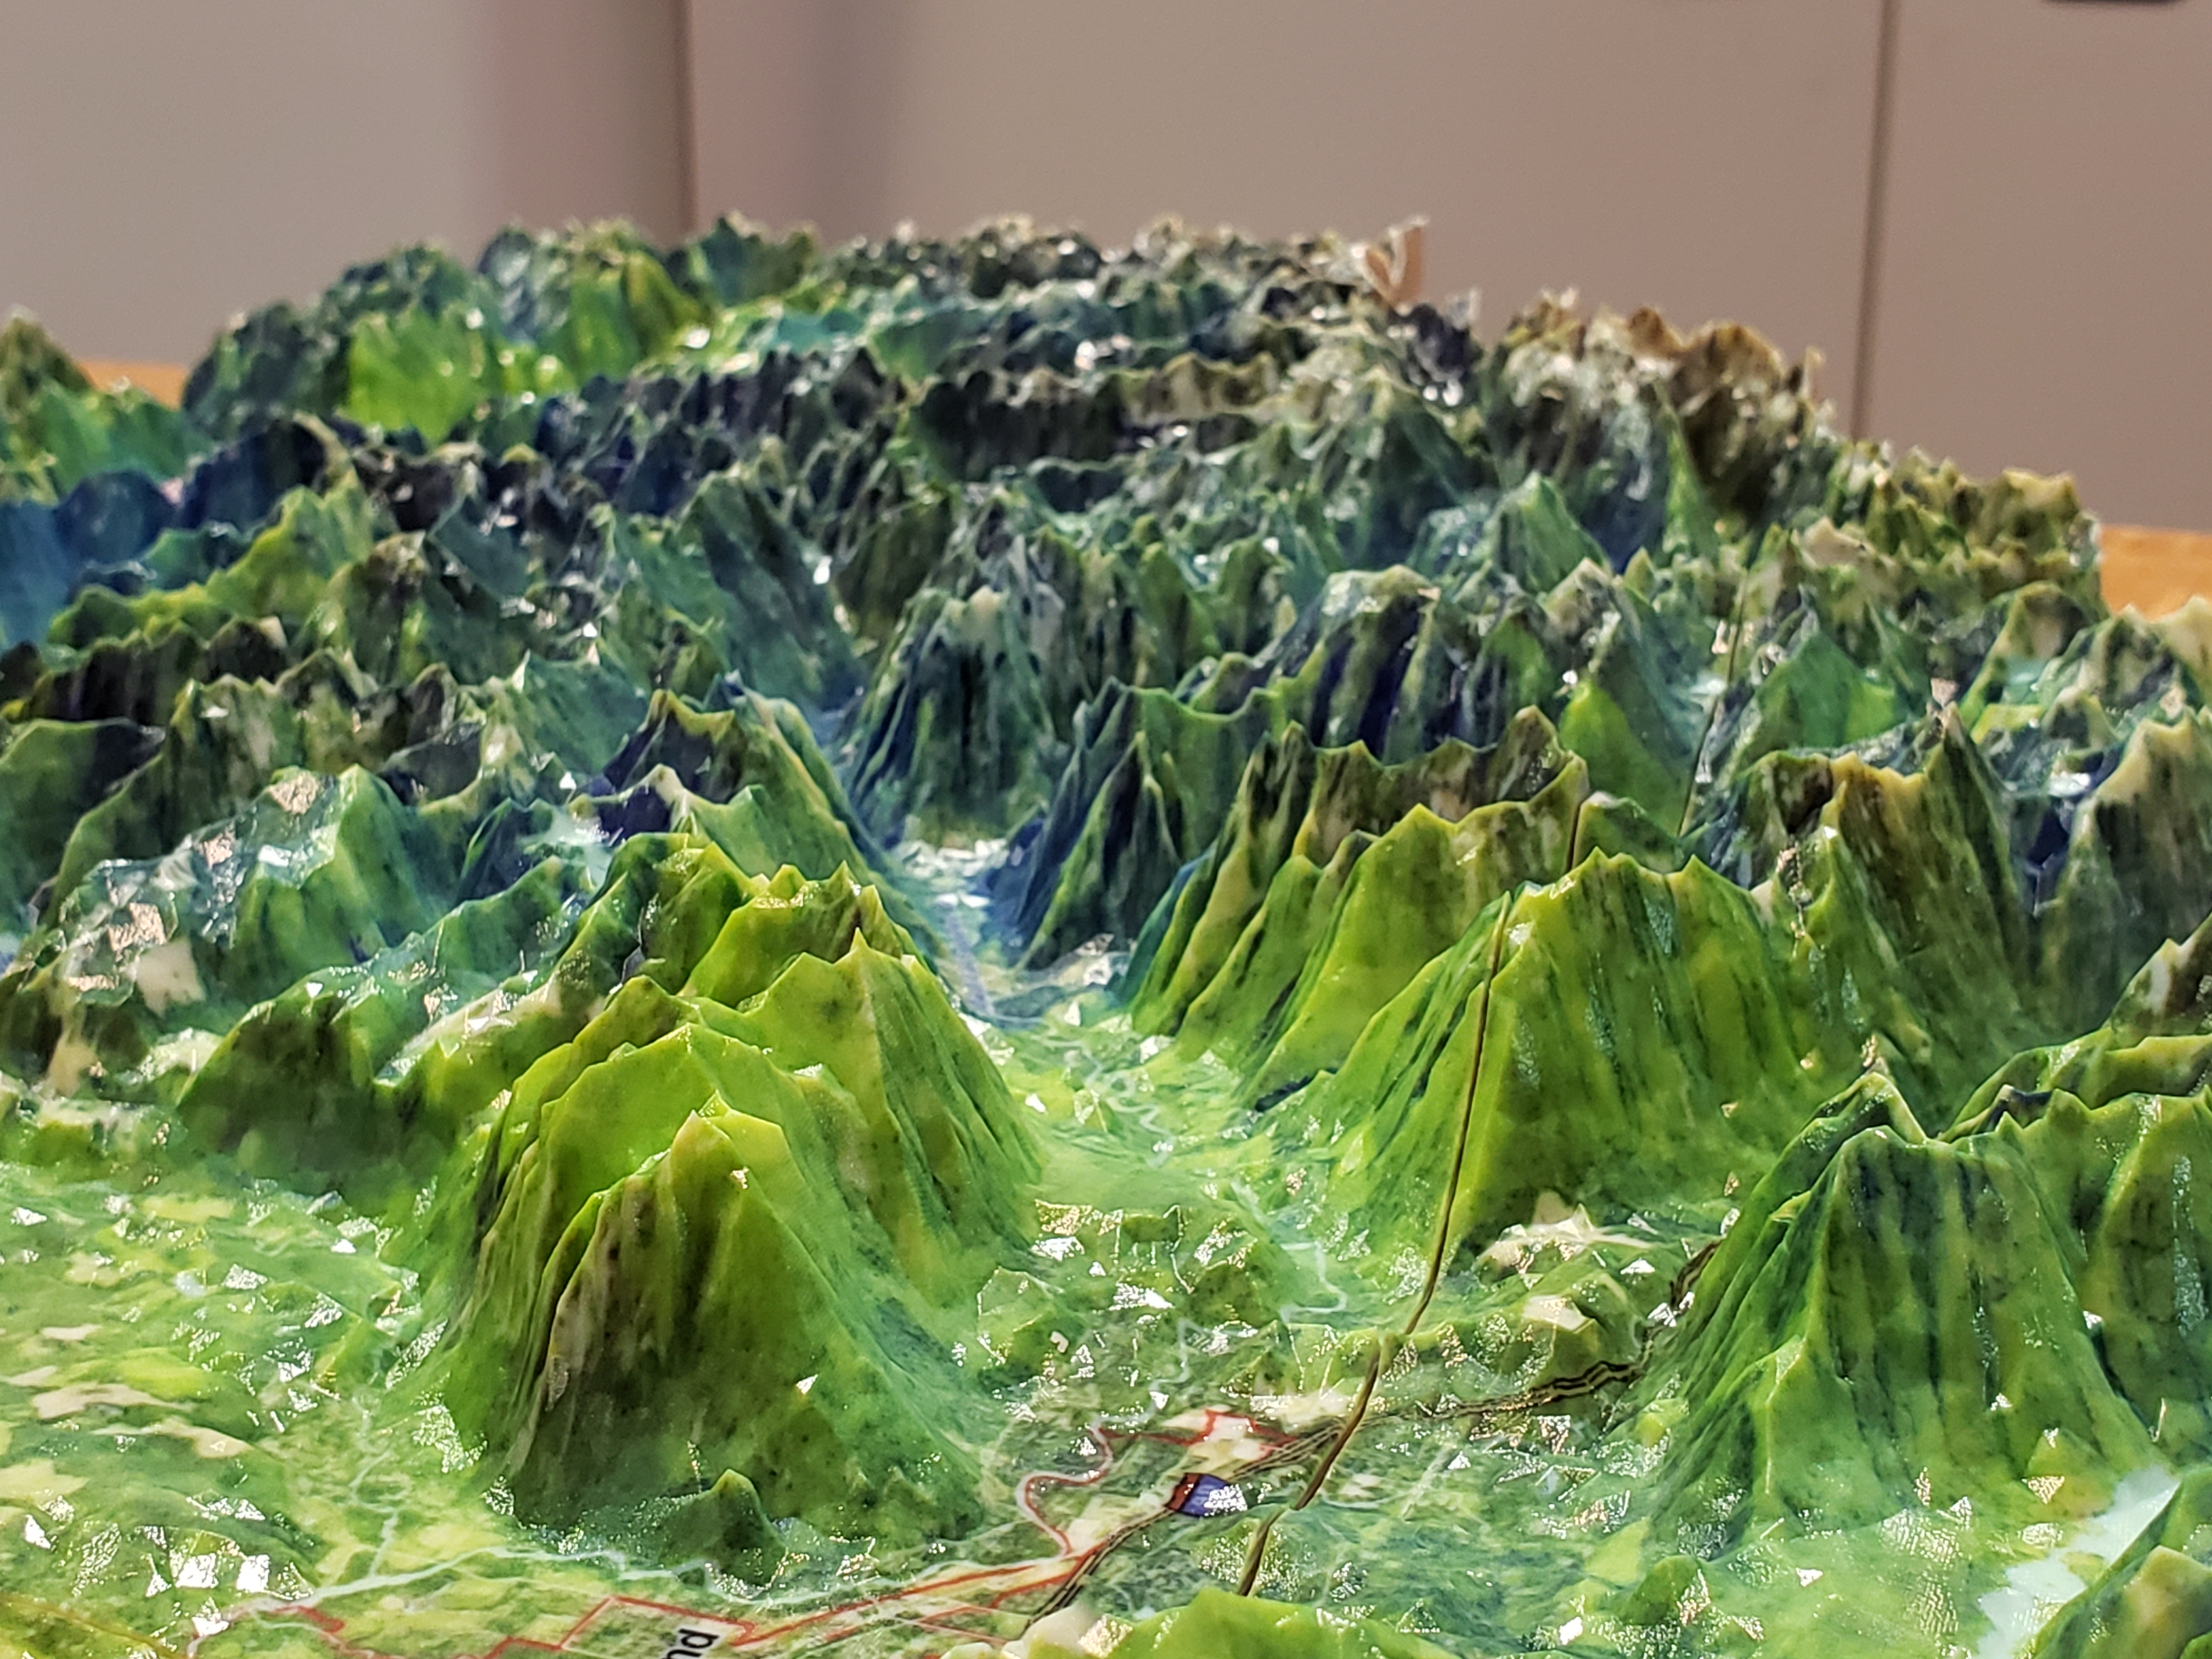
Our role in the updates was the creation of a suite of maps and related products to show the locations of natural hazards. Our products included a series of illustrations for the report, an indexed atlas of 40 hazard maps, an interactive online map of hazard areas in the county, and a tabletop-size, 3D-printed topographical model of the county.


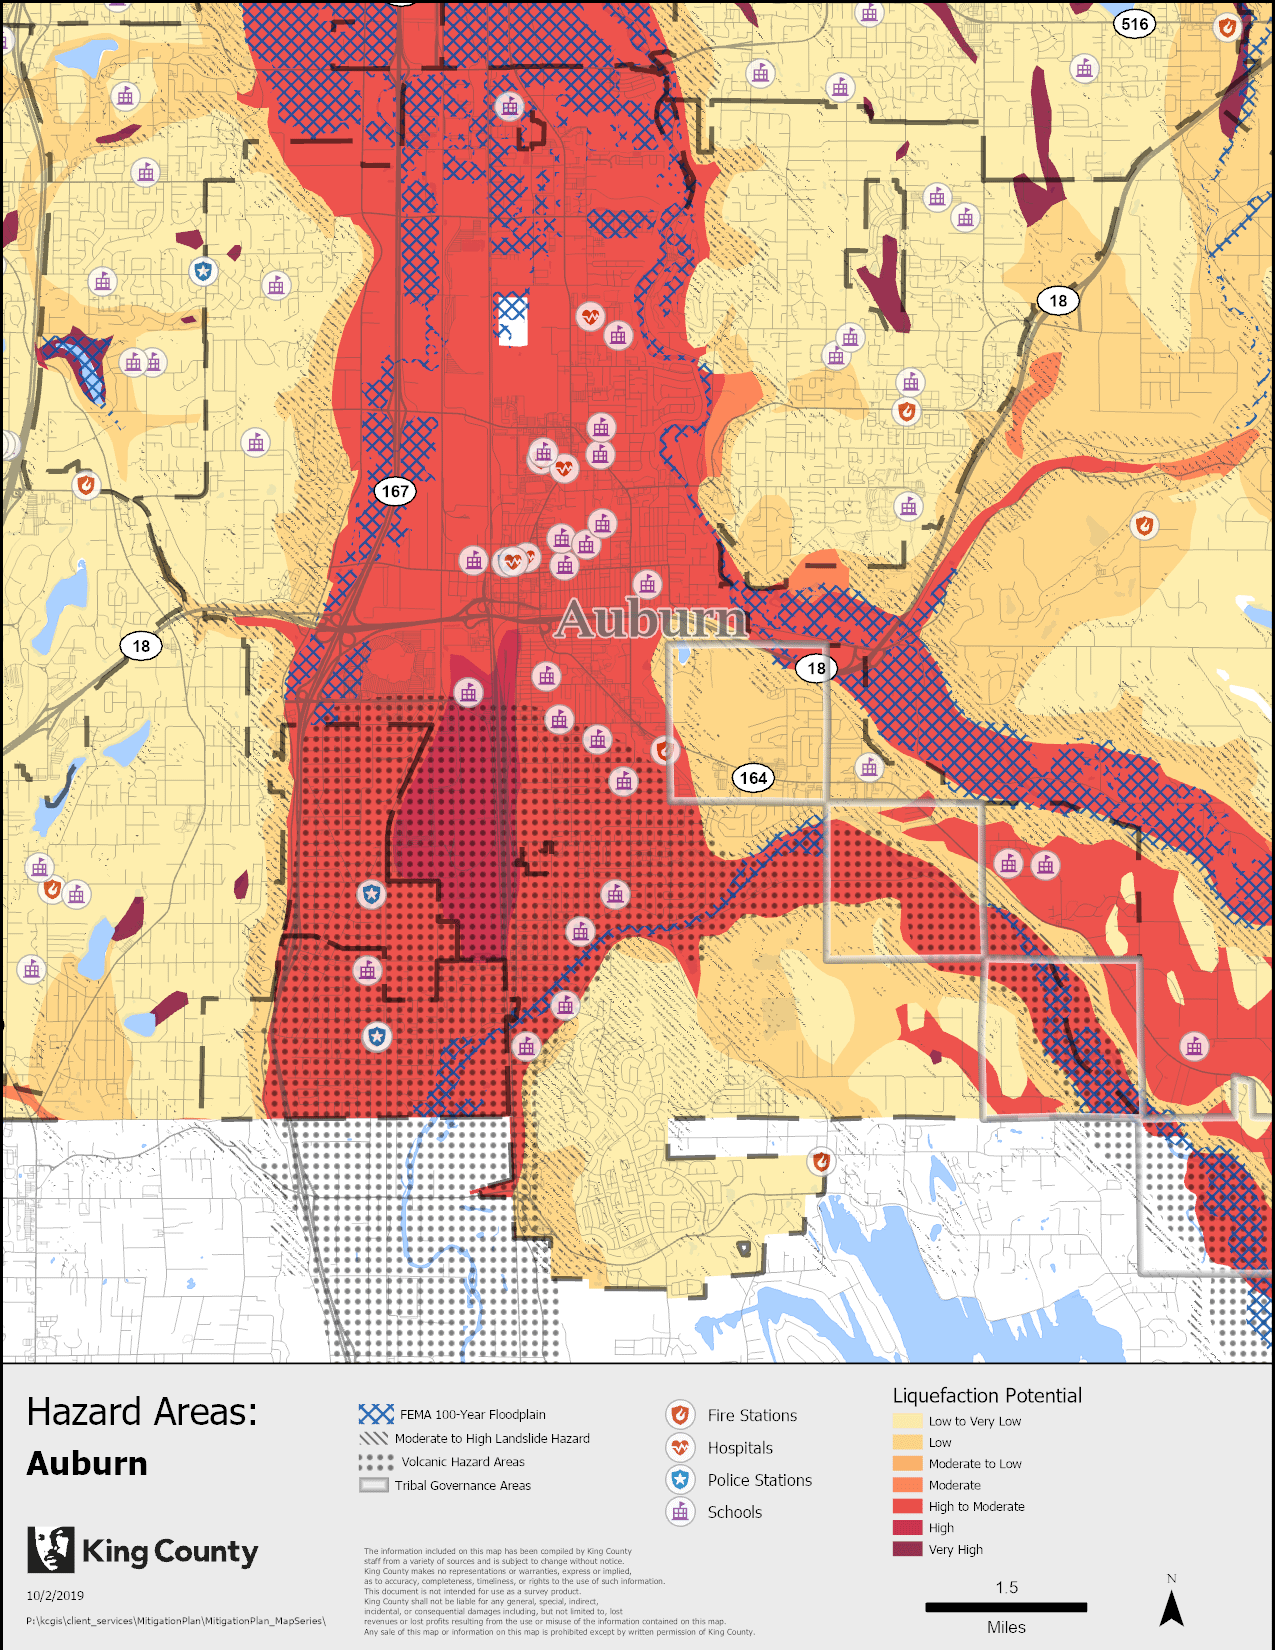
The hazards identified and mapped included liquefaction potential, 100-year floodplains, volcanic and lahar zones, and potential landslide areas. These dangers were overlaid with a variety of potentially vulnerable infrastructure, allowing the Office of Emergency Management to identify potential risks and consequences of hazard impacts for a variety of populations and structures.
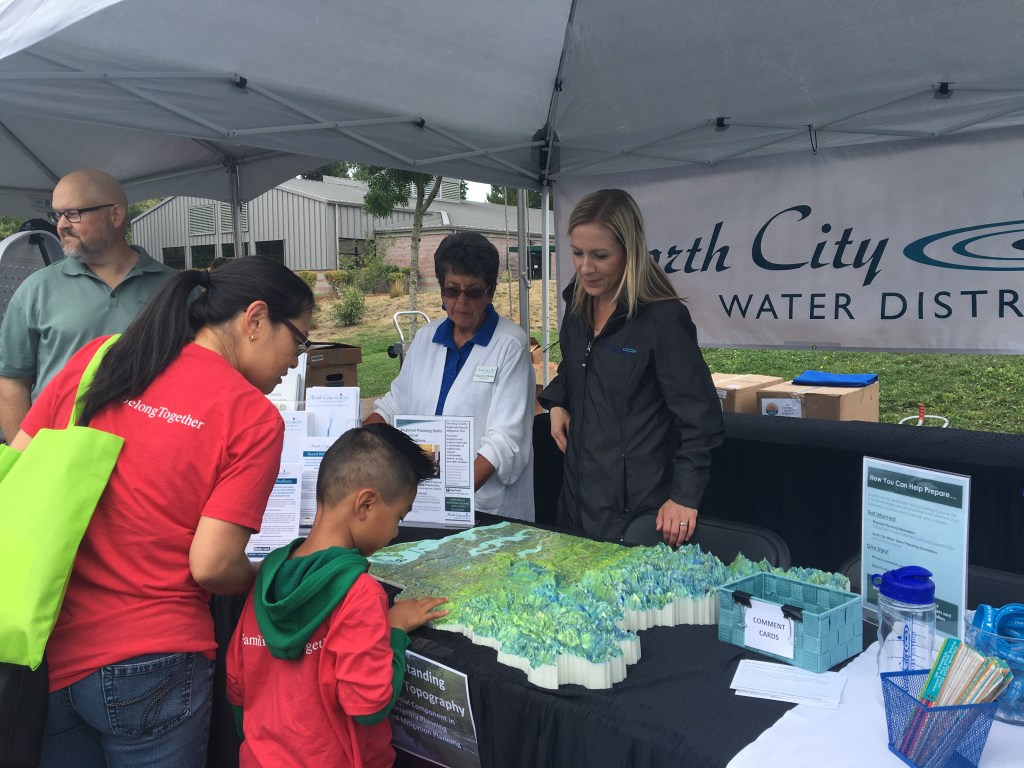

In addition to illustrating hazards in the assessment, the products produced by the KCGIS Center are being used to communicate with the public. The 3D map has been on display at farmers markets and community meetings, and the paper maps as a part of literature distributed to the public.
For more information about the 3D topographic model of the county, check out these other GIS & You articles.
Virtual to physical: translating a 3D landscape to a printed model
Converting digital terrain data into a 3D printed model of King County


Very insightful post, thanks a lot for sharing this!
LikeLike