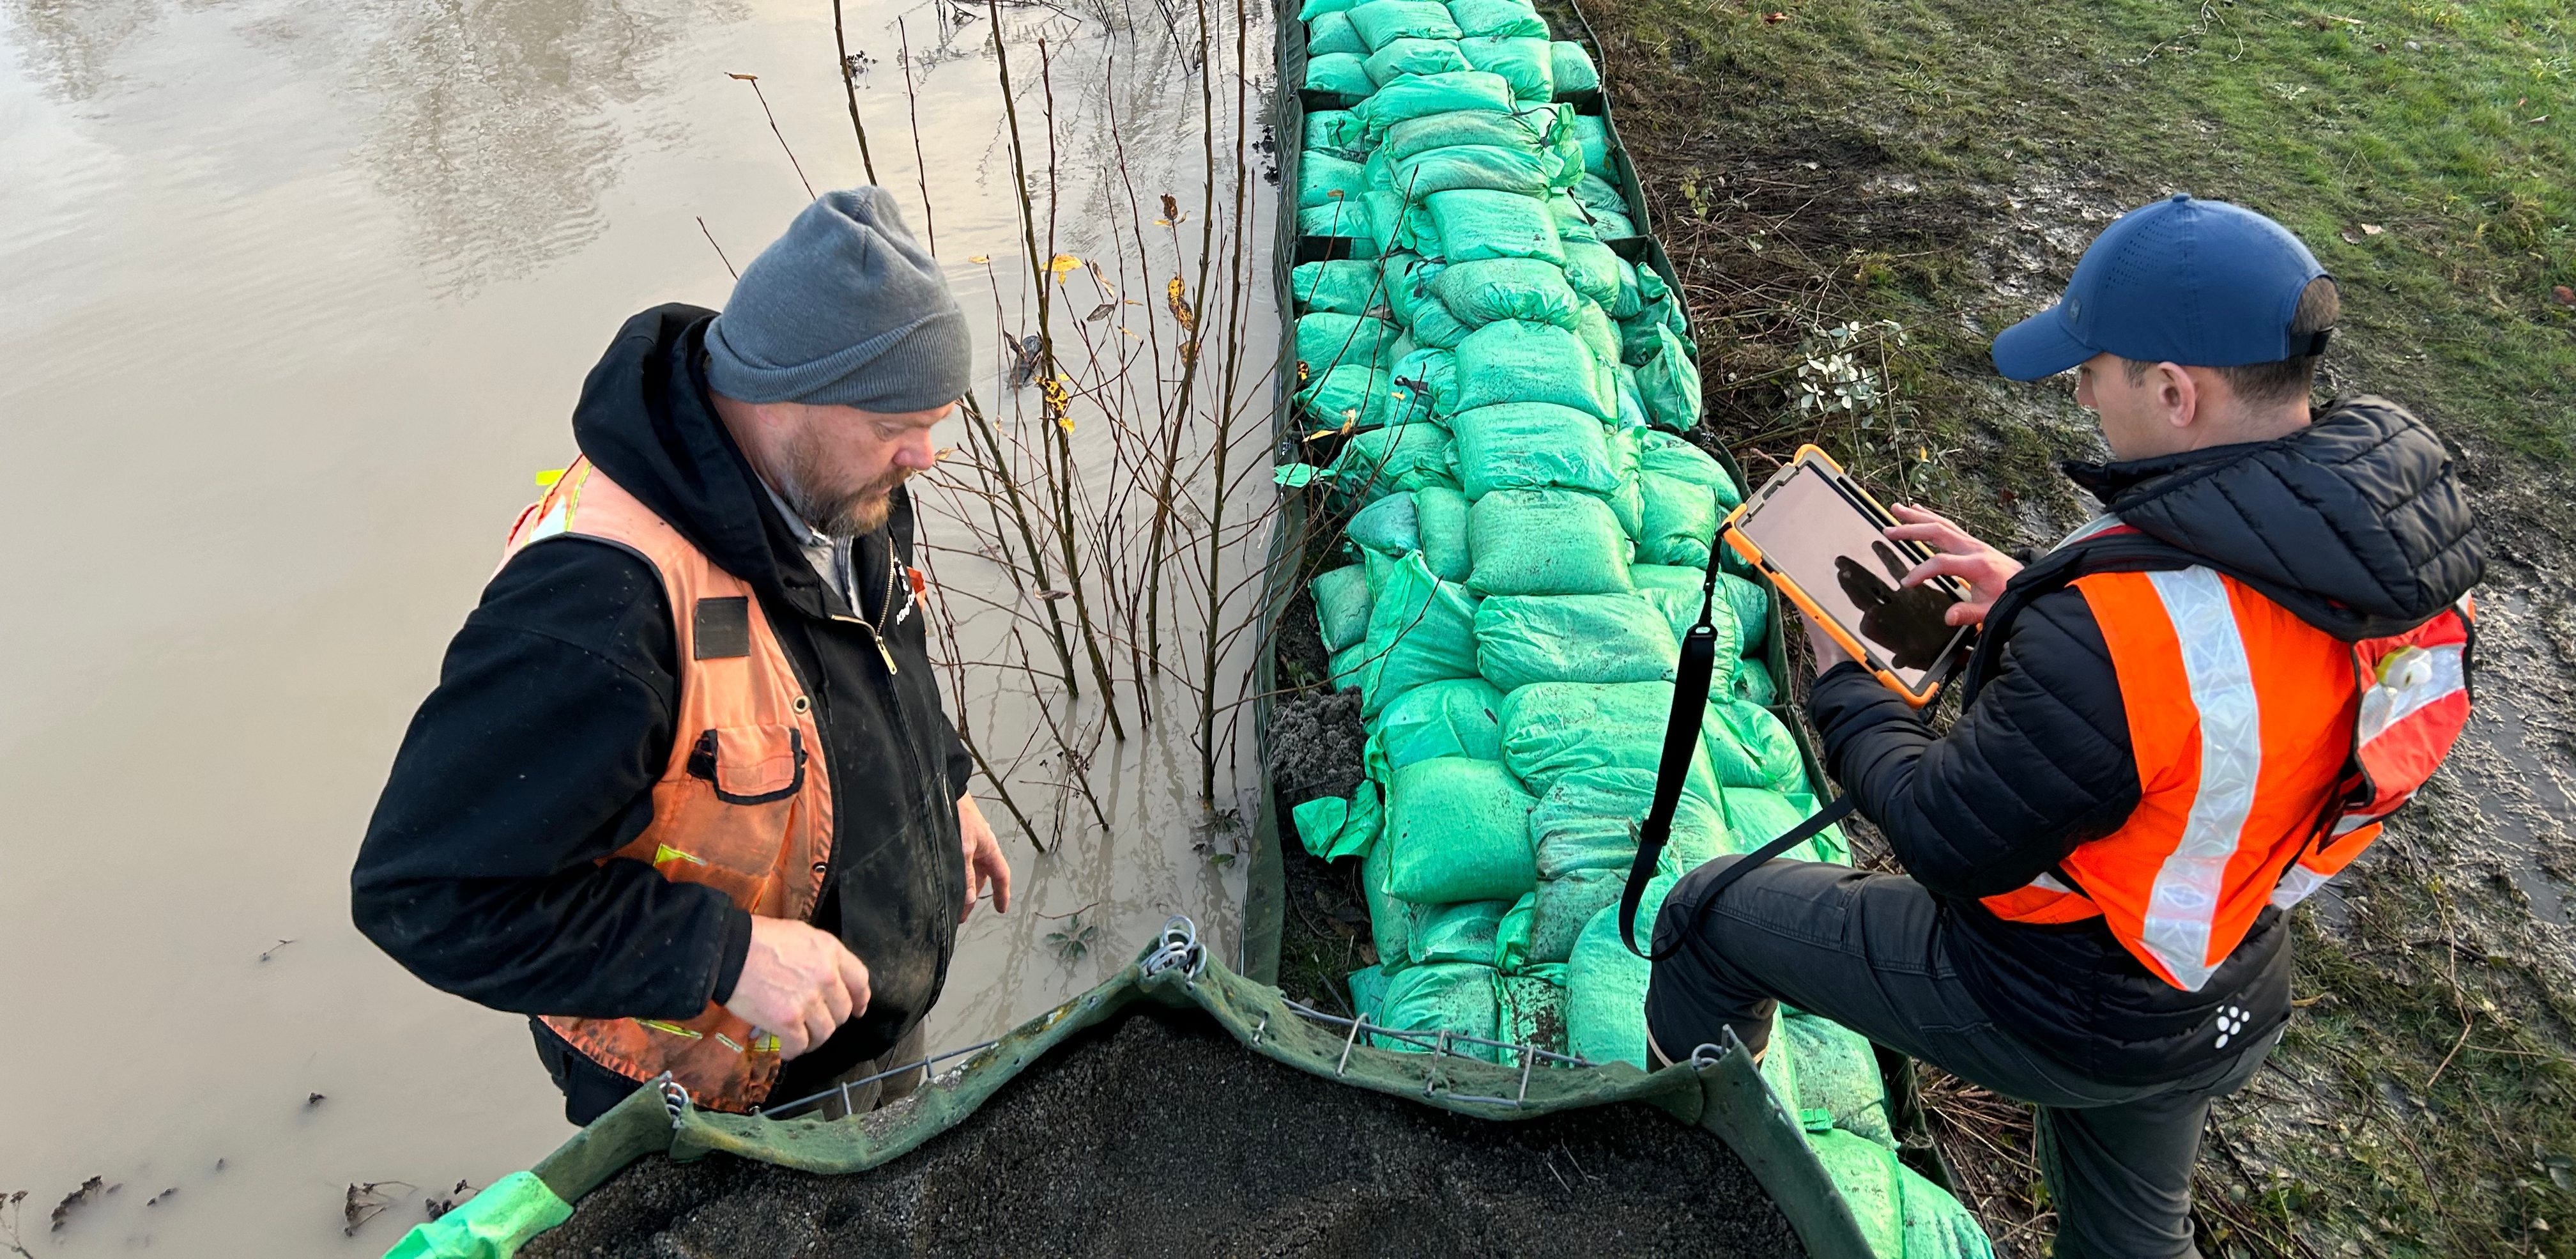
December 2025 saw record-breaking flooding in the Pacific Northwest. With some areas seeing over 15 inches of rain in 72 hours, our region saw damage to more than 400 residences, two levee failures, and several major road closures.
The Regional Communication and Emergency Coordination Center (RCECC) requested 24-hour GIS coverage beginning on December 10, 2025. Tasked with providing situational awareness for Emergency Management staff and the public, the GIS Center quickly got to work.
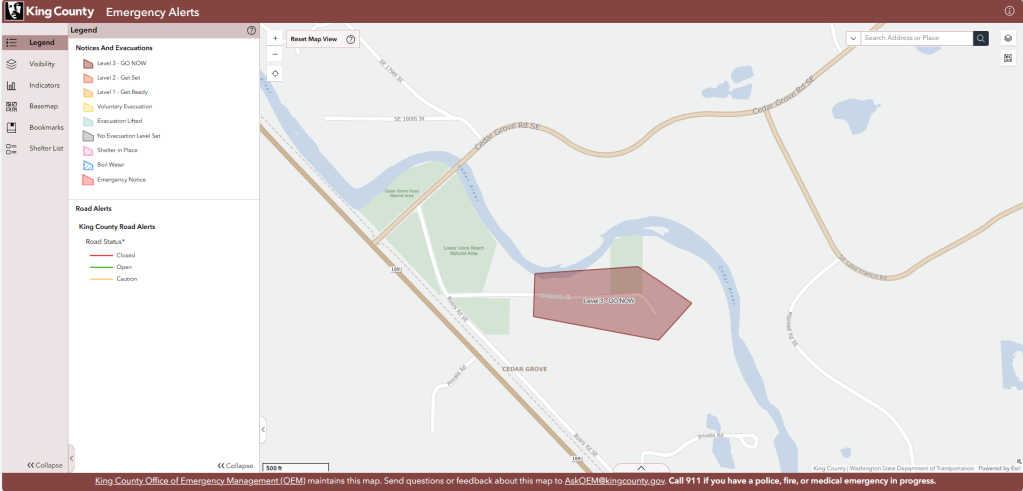
Public dashboards are vital to sharing emergency-related information. A simplified GIS dashboard was displayed on https://kcemergency.com/ .
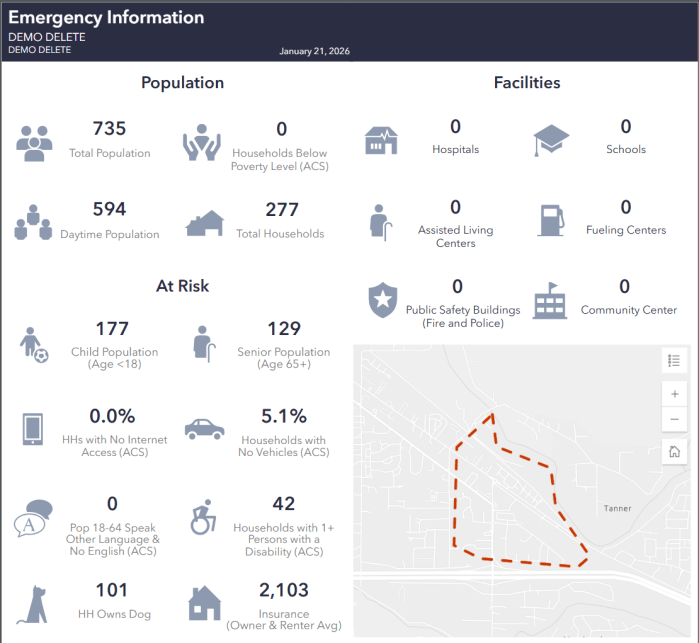
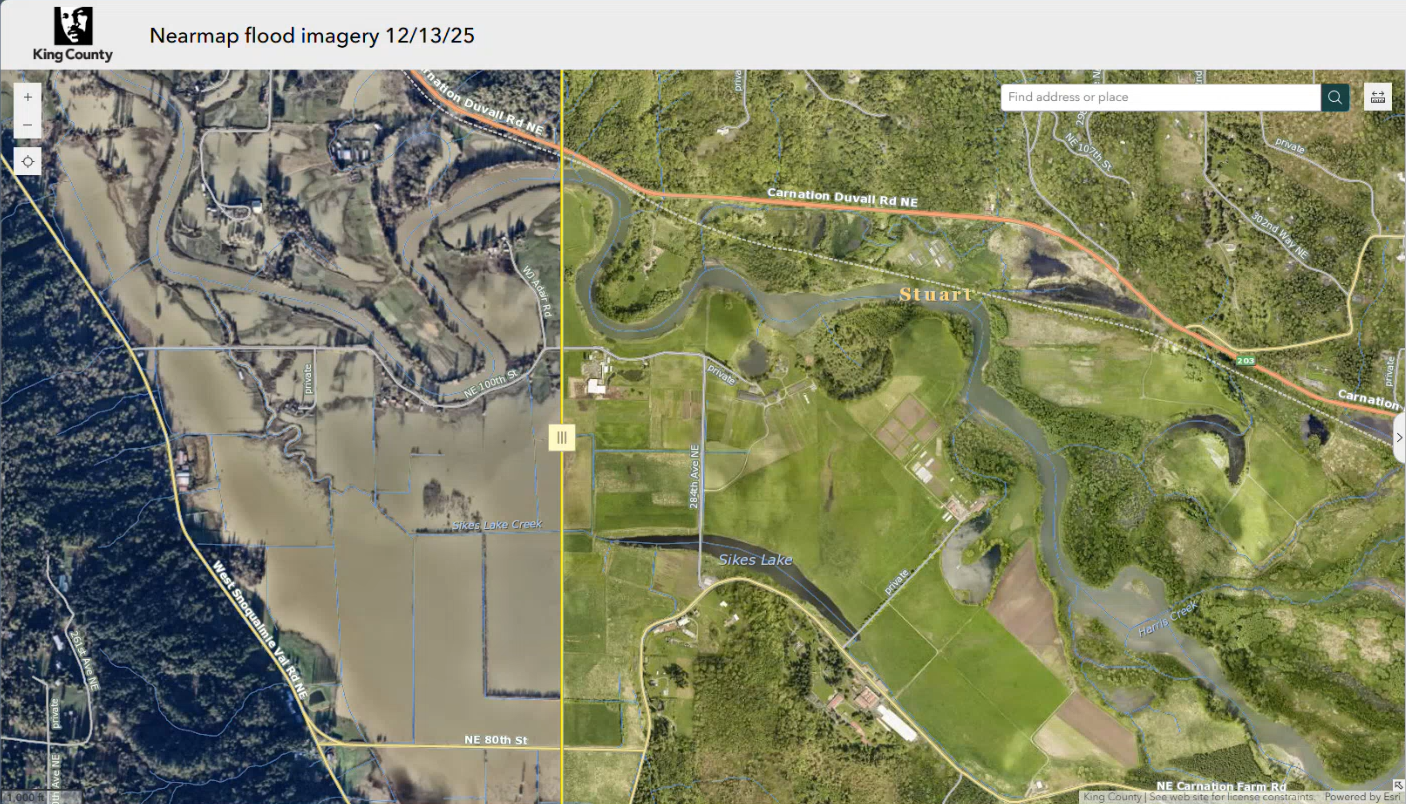
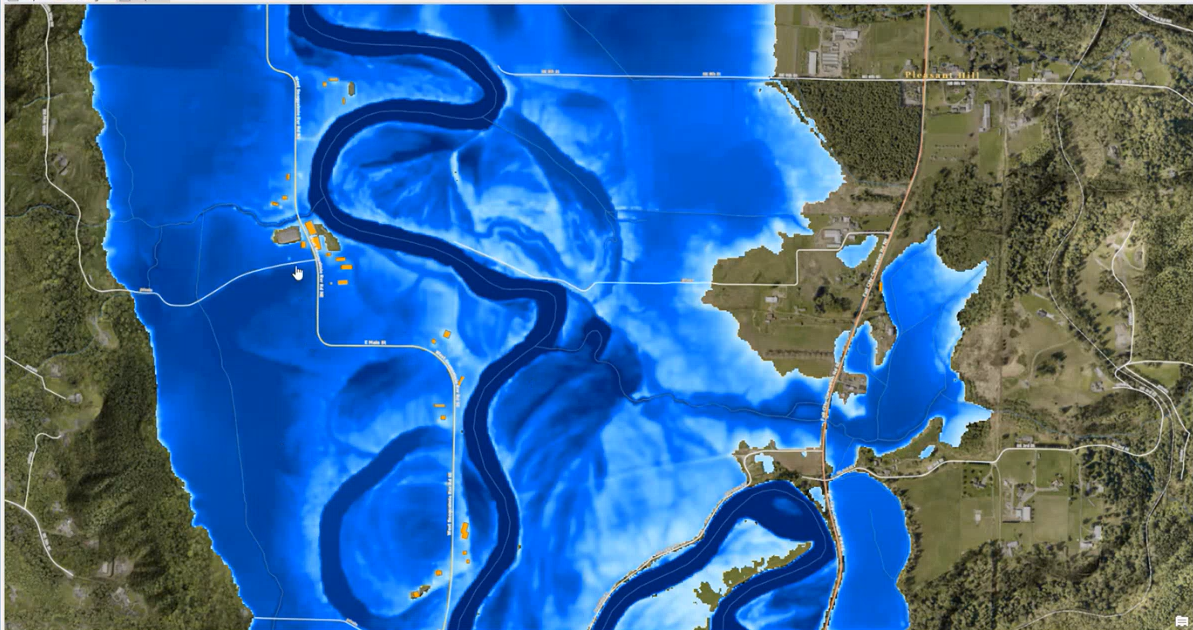
Emergency Management personnel need as much information as possible to make the best decisions. With GIS, information from a variety of sources can be combined to provide the best available operating picture. For the recent flooding, information like water inundation extent models, identification of communities impacted by road closures, levee failure scenarios, chemical facilities, nursing homes, demographics and much more were all available on a single map to help inform decision making.
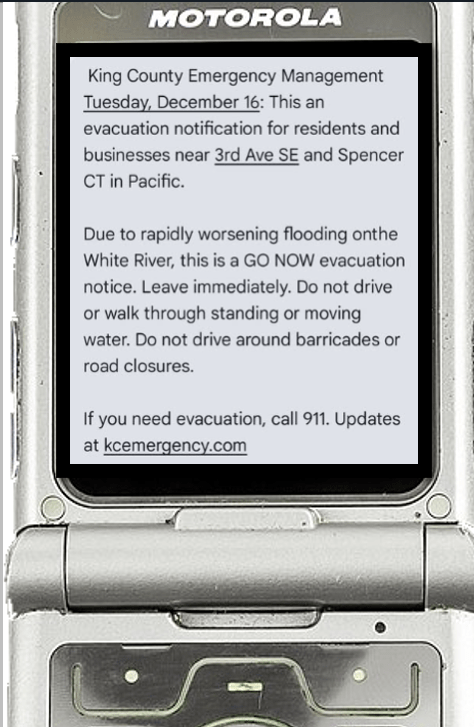
GIS data also feeds into a text message alert system called CodeRed. By inputting an area on the map, text messages can be sent to citizens in that specific area for targeted information and notifications. More than 280,000 alerts were sent out during the December 2025 floods.
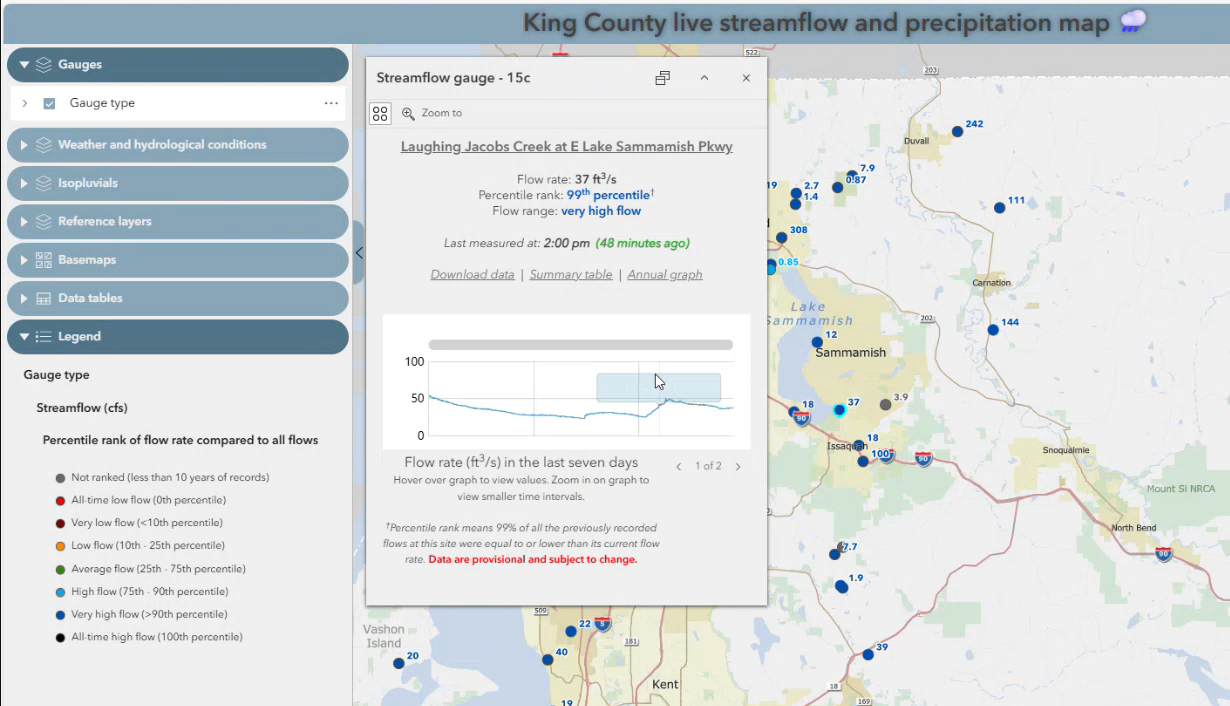
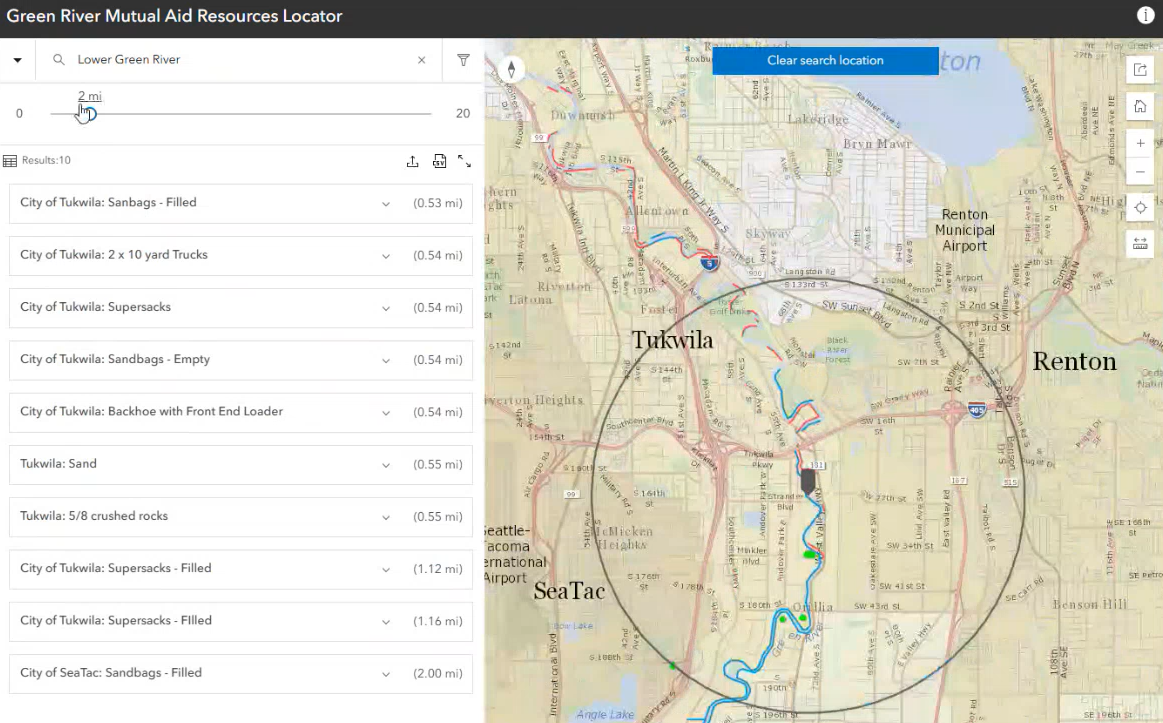
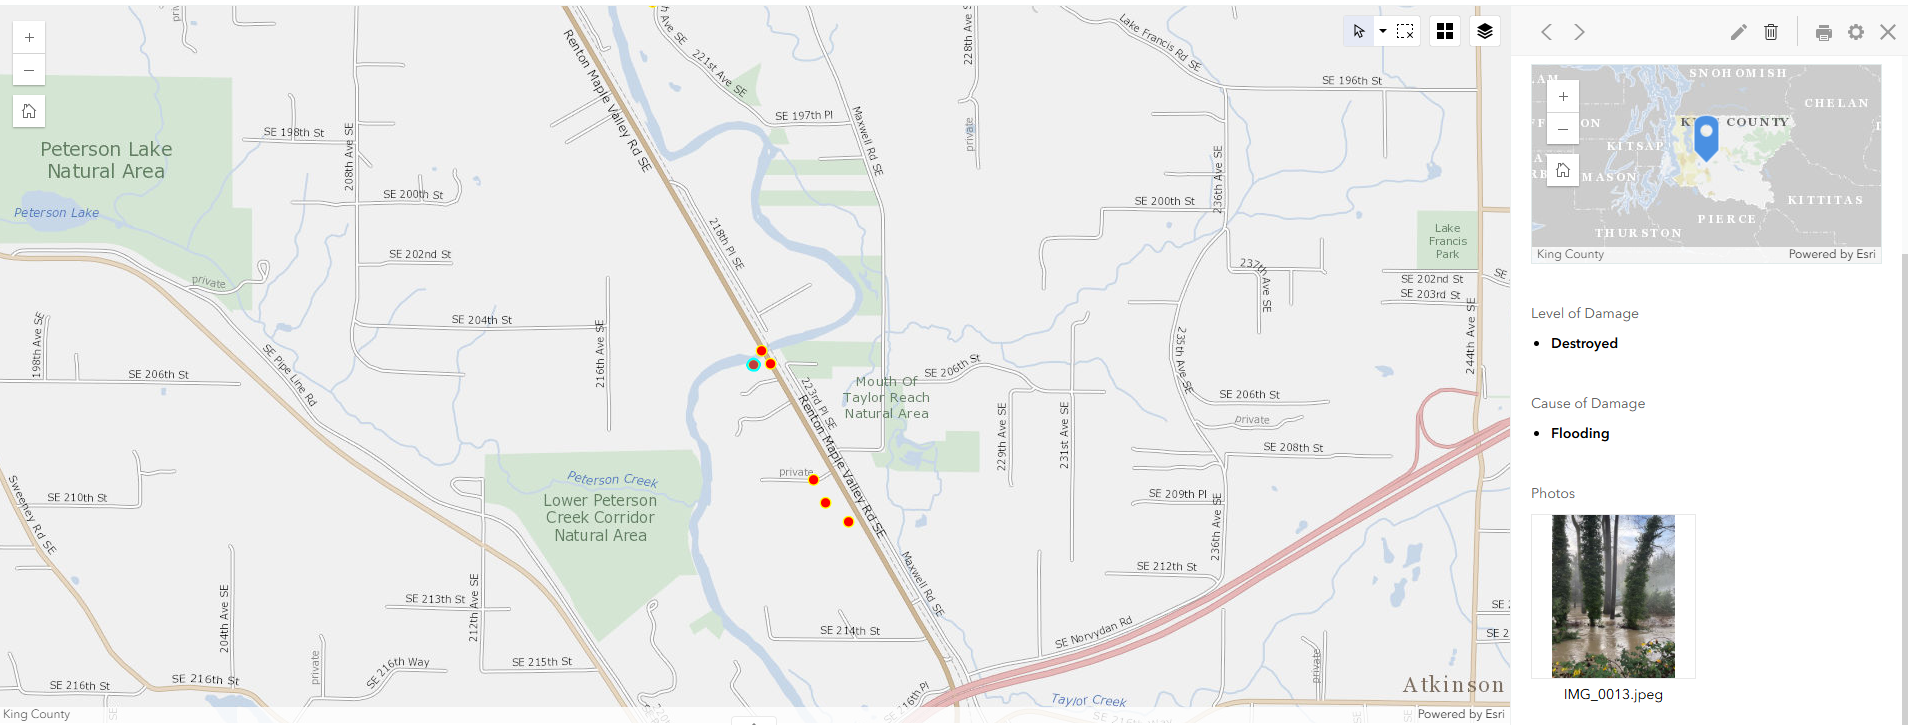
GIS was used to great effect beyond dashboards and situational awareness. Explore the gallery below to view other examples of GIS flood response.

GIS will continue to be vital before, during and after emergency-related incidents. We look forward to seeing our partnership with the Office of Emergency Management continue to grow.


