Have you ever waited impatiently for a critical report to load, only to be met with a timeout? The GIS Center faced this issue with the King County Districts and Development Conditions report (DDCR), specifically for parcels with multiple Shoreline Management Designations last month. Let’s review how we understood this problem and solved it!
Why Shorelines matter…
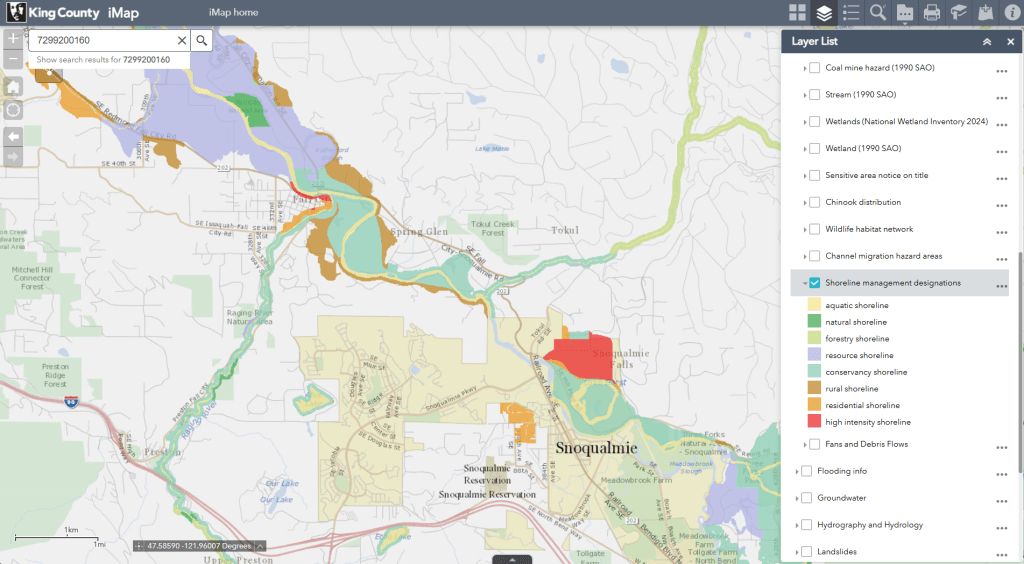
According to the Department of Ecology at the State of Washington, “… Shoreline Management Designations are classifications of shoreline areas that reflect local shoreline conditions, including ecological functions and shoreline development.” In King County, portions of properties along major rivers and the Puget Sound shoreline of Vashon Island typically qualify for this designation. There are eight Shoreline Designations in this dataset ranging from common designations like Aquatic and Natural shoreline to less common variations like Residential and High Intensity shoreline. Shorelines inside municipalities (like Seattle) are not regulated by King County and aren’t in this dataset.
When you query for a parcel using the DDCR, the application checks to see if it is in a Shoreline Management Designation area. If it does, the application runs an additional check deliver detailed data on all the designations that apply. There can be more than one designation, especially for large rural parcels. To support permitting workflows for residents, real-estate developers, districts, and our own permitting team we calculate the percentage of the parcel that is covered by each Shoreline Management Designation.
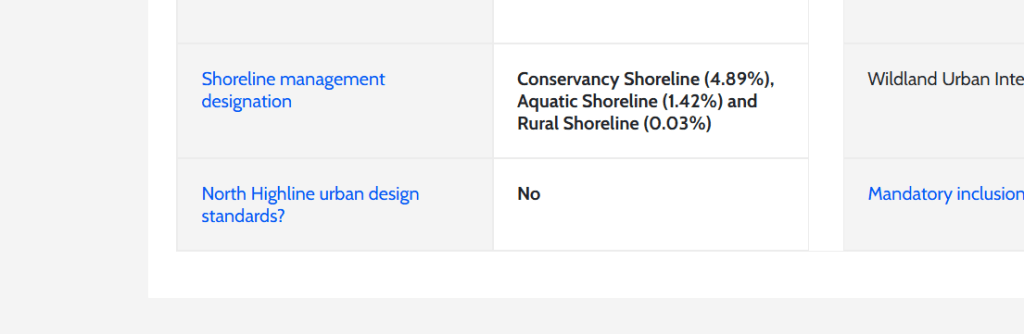
You can see this information in the second row from the bottom on the left-hand table at the end of this report on parcel number 7299200160.
When performance becomes a problem
For a parcel that doesn’t qualify it typically takes 1-2 seconds to generate this report, for a parcel that does qualify it could take much longer up to 20 or more seconds in some cases. This gap in performance led to pages failing to load on our website a few weeks ago.

Users would look up a parcel with multiple Shoreline Management Designations and be greeted with an unfriendly “504 gateway timeout” response. Our traffic management resources in Microsoft’s Azure cloud were timing out requests to the front-end app hosted in Azure’s App Service after about 20 seconds or so. We were able to triage this issue by updating the rule set to increase the timeout period to 30 seconds.
Of course, this is not the long-term solution to the problem. When we ran a query for a qualifying parcel on our County-provided laptops, it would load in 5 to 6 seconds. Not great, but functional. But when performed the same query on infrastructure in Azure it would take 18 to 21 seconds to load. What happened to make the same request for data so much slower in the cloud?
Finding the problem
We explored different avenues like looking at database performance, web server logs, web application firewall logs, application telemetry from Azure Application Insights, and even using the Lighthouse benchmark embedded in the inspect tools of Chrome and Edge. [1] None of this could shine a light (haha) on what was going wrong other than to show that requests were taking much longer to complete in Azure than on my local machine.
In an “Aha!” moment, it occurred to me that this might be a performance problem in the rawest sense. My laptop has eight processor cores, an SSD, and 64 GBs of RAM. What did our hosting environment in Azure offer? Well, it was configured to use the S1 tier, offering a paltry 1 virtual processor and 1.75 GBs of RAM.
To confirm my suspicion, I upgraded the dev server from the S1 tier to the cheapest recommended option for production workloads P0v3 with a faster processor and 4 GBs of RAM. The performance impact was immediate: from 21 seconds of boredom and terror we had chopped it down to a restful 8 seconds of patience. Of course, this change nearly doubled the hosting cost of this app but given that we’d probably be forced to migrate eventually and that the total sum was still small, this burden was acceptable.
Rethinking our process
With the timeouts resolved, we circled back to thinking of structural solutions to this performance problem. We already ran this expensive query for only a subset of parcels where we knew from a much faster query that they qualified. We benchmarked the portion of this process that made an HTTP request to a remote dependency and saw that it returned in just a few hundred milliseconds, so we could rule that out as the problem.
Using the geometry data returned by the prior HTTP request, the application code uses the library called NetTopologySuite to calculate the portion of the parcel that overlaps with each of the Shoreline Management Designation polygon. Disabling this overlap calculation cut page load time down from about 8 seconds to 2 seconds. Clearly this was the expensive portion of the process that we needed to rearchitect.
A Sequel Solution
The DDCR is different from typical web-based GIS applications like Parcel Viewer or Roads Asset Editor because there is no interactive map. Rather, it’s a series of tables containing key characteristics of a specific parcel. Because we don’t need to render this data on a map, we don’t need to use ESRI’s Map Service APIs. Rather, we can make the page load faster by directly querying the database tables supporting those Map Services using SQL.
To support using spatial query we had to convert this the polygon feature class from using SDE_Binary to SQL Server’s native geometry column type. With the exception of the sub-query, this is a pretty straight forward SQL solution to a problem that was more complex to solve using calls to a REST API and in-app processing.
Here’s the spatial query itself:
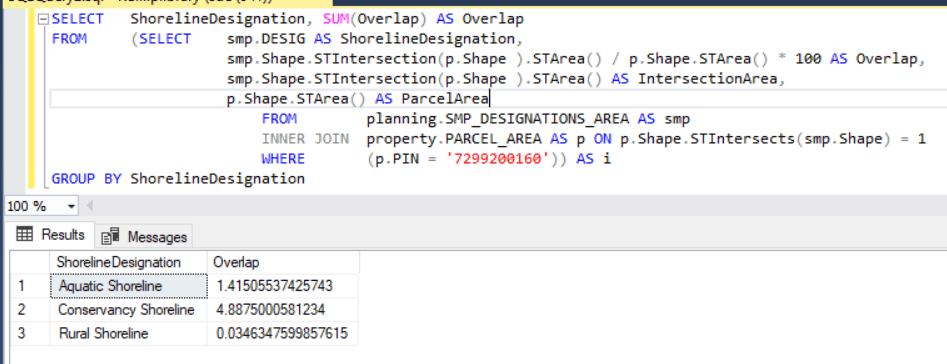
We now use a spatial query to calculate the overlap of the parcel and the designation polygons. This query replaced a 60-line function for handling Shoreline Management Designations with a 6-line function that returns the results of the query. This cut page load times from ~5.5 seconds to just ~2 seconds.
Parcels that don’t qualify for a Shoreline Management Designation still load faster than those that do, but we’ve cut the gap down by order of magnitude and now it’s hardly noticeable. From an initial ~21 seconds down to just ~2 seconds to load a page with a worst-case parcel.
At the King County GIS Center, we are always working to improve our public services. This update to the DDCR is an example of our continuous improvement efforts to save you time. If you like the work we are doing here at the King County GIS Center, tell your friends and please enjoy the updated Districts and Development Conditions Report!
Update @ September 16th, 2025
The DDCR has been updated to replace all usage of ESRI’s MapService APIs with functionally equivalent spatial SQL queries in the pattern described above. Although the performance gains are smaller than the big win we got with the Shorelines query, performance has been improved. More importantly we’ve simplified the architecture of the app by removing an intermediate layer between the presentation of the DDCR and the source of the data. This reduces the maintenance burden for the app and makes it easier to troubleshoot bugs like the outage described above.


